The Boonton 55006 USB Peak Power Sensor, Wi-Fi 802.11ac Signals and the ETSI EN 300 328 Standard
Stephen Shaw - Applications Engineer, Boonton Electronics | Open as PDF
Abstract
 This application note describes how the Boonton 55006 USB Peak Power Sensor can make fast and accurate time and statistical domain power measurements of Wi-Fi 802.11ac signals. This new protocol, developed between 2011 and 2013 and approved in January 2014, delivers high throughput Wireless Local Area Networks (WLANs) on the 5GHz band, and must comply with the ETSI EN 300 328 Standard for wideband transmission systems. The following describes how the superior performance of the 55006 ensures that all the measurements required by the standard can be made to an unprecedented level of accuracy. As well as the measurement requirements of the ETSI specifications, the article also describes how the capabilities of the sensor can be used to carry out many more in depth measurements of these types of signals.
The Peak Power Sensor
The Boonton 55006 USB Peak Power Sensor functions as an ultra-fast, calibrated power measurement tool which acquires and computes the instantaneous, average and peak RF power of a wideband modulated RF signal. The internal A/D converter operates at up to 100 MSamples/second, and a digital signal processor carries out the work required to form the digital samples into a correctly scaled and calibrated trace on the display. Figure 1 shows a block diagram of the peak power sensor.
The Detector
The first and most critical stage of a peak power sensor is the detector, which removes the RF carrier signal and outputs the amplitude of the modulating signal. The width of the detector's video bandwidth dictates the sensor's ability to track the power envelope of the RF signal. The picture on the left in Figure 2 below shows how a detector with insufficient bandwidth is unable to faithfully track the signal's envelope, therefore affecting the accuracy of the power measurement. The detector on the right has sufficient video bandwidth in order to track the envelope accurately.
By optimizing the sensor's response time it is possible for the detector to track very fast amplitude changes due to modulation. The video bandwidth of the sensor must be at least as wide as the signal's modulation bandwidth in order to be able to accurately track it. The 55006 achieves an industry leading video bandwidth of 195MHz for spread-spectrum signals and measures rise times as fast as 3ns, therefore enabling the analysis of both very short bursts and very broadband signals.
The fast detectors used in peak power sensors are by their nature non-linear, so shaping procedures within the digital processor must be used in order to linearize their response. When measuring instantaneous peak power, a high sample rate is important in order to ensure that no information is lost. The 55006 has a sample rate of 100MHz, and so is able to analyze power versus time waveforms in very high resolution. However, when measuring average power, a lower sample rate is acceptable as long as a sufficient amount of samples are captured. This point will be covered in the "Buffered Mode" section later in the article when discussing the requirements of the ETSI specification.
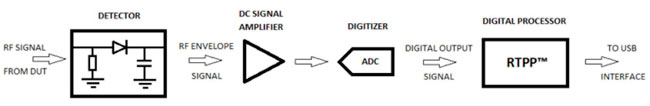
Figure 1. RTPP™ refers to Boonton's unique Real Time Power Processing technology, described later in the article.
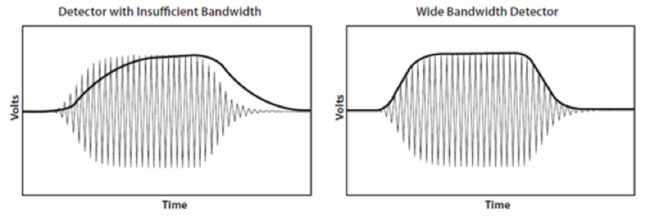
Figure 2: The Importance of Detector Bandwidth
The Wi-Fi 802.11ac Signal
Bandwidth Requirements
The 802.11ac Wi-Fi protocol is driving the next generation of high throughput wireless systems, raising data rates up to a maximum of 6.93 Gbps. It transmits at 5GHz, and enables devices to support channels with bandwidths of 20, 40 and 80MHz. It also includes wider channel bandwidths of non-contiguous 80+80MHz and contiguous 160MHz configurations. This increased bandwidth comes with a higher order of modulation.
Modulation
802.11ac uses Orthogonal Frequency Division Multiplexing (OFDM), which employs a large number of closely spaced subcarriers which are modulated at a low data rate. These subcarriers are orthogonal to each other, meaning that there can be no mutual interference. The transmitted data is shared amongst the carriers in order to give high immunity against selective fading from multipath effects. Each sub-carrier has a bandwidth of 312.5kHz, and is individually modulated using a standard scheme such as Quadrature Phase Shift Keying (QPSK), Binary Phase Shift Keying (BPSK), 16 Quadrature Amplitude Modulation (QAM), 64 QAM and 256 QAM.
Synchronized Multi-Port Measurements
802.11ac also employs MIMO processing (Multiple Input Multiple Output), which utilizes up to eight antennas at both the transmitter and the receiver in order to increase both its data throughput and its spectral efficiency. This technology exploits the phenomenon known as multipath interference, which normally has a detrimental effect on the received signal. However, with multiple data streams transmitted on the same channel and powerful digital signal processing at the receiver, MIMO offers a greatly increased data capacity as well as immunity against fade conditions. The ETSI standard requires synchronized power measurements on all ports of the transmitter, which can be easily carried out using the required number of 55006 sensors. The sensors' software supports up to 16 or 32 channels, depending on the configuration.
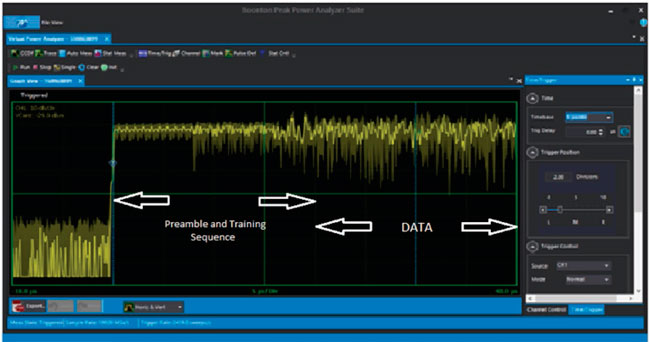
Figure 3. A typical Wi-Fi 802.11ac signal measured by the Boonton 55006 Peak Power Sensor:
The ETSI EN 300 328 Standard – How to Measure the Tx Power of 802.11ac
With new technology comes new standards which have to be tested and verified. The ETSI EN 300 328 Standard applies to wideband transmission systems such as Wi-Fi 802.11ac, and stipulates a series of requirements to which the technology must conform.
Section 5.3.2 of the standard is concerned with measuring RF output power. In summary, the requirements are:
- The power sensor should be suitable for 5GHz RF.
- Sampling speed should be at least 1 MSamples/sec.
- Measurement duration should be long enough to ensure that at least 10 bursts are captured.
- A power sensor should be connected to each transmit port in order to carry out a synchronous measurement on all ports. The sensors should be triggered so that they start sampling at the same time.
- The power of the individual samples of all ports should be summed, and the resulting data should be used to calculate the following:
- Find and store the start and stop times of each burst. This is where the band limited power is at least 20dB below the average burst power (described in point 2 below).
- Calculate and store the average power between the start and stop times of each burst.
- Record the highest average power value found in point 2 above. This value will be used for maximum EIRP (Equivalent Isotropically Radiated Power) values.
Boonton's Solution to 802.11ac Measurement Challenges
Real Time Power Processing™
Boonton has developed a new signal processing technology called Real Time Power Processing (RTPP™) which is a key factor in ensuring the accuracy of Wi-Fi measurements. Unique to Boonton, this advanced technique enables the sensors to constantly collect samples without any gaps in their acquisition, ensuring that no data is lost. The conventional method involves collecting samples until the sensor's buffer is full, at which point acquisition stops until the collected samples are processed. RTPP™ collects and processes samples so quickly that the buffer is never filled. In order to create a trace on the screen, conventional meters and USB sensors carry out the required steps in sequence, which therefore means that processing can take as long as tens or hundreds of milliseconds. Real Time Power Processing performs many of these steps in parallel, and at full acquisition rate, so it is therefore not necessary to halt acquisition following a trigger event to wait for the processing stages to catch up.
Buffered Mode
Buffered mode works in conjunction with RTPP™ to provide all the relevant burst information, including crest factor. Immediately upon acquisition, the raw samples are processed and analysed to yield all desired burst measurements, so only the relevant information is stored for each burst. This means that the sensor can operate at its maximum sample rate of 100 MSamples/second and work simply with burst information without needing to store raw samples for post-analysis. At this stage it would be useful to consider the Nyquist Theory, which states that in order to digitally reconstruct an RF signal the sample rate must be at least twice that of its modulation bandwidth. It is therefore evident that 100 MSamples/second is in theory only sufficient to handle bandwidths up to 50MHz, hence presenting a potential problem when measuring 802.11ac bandwidths of 80Mhz and 160MHz. However, Nyquist limitations have no bearing when using Buffered Mode because statistical techniques are employed which do not require waveform reconstruction. Boonton's 55006 Peak Power Sensors have the ability to record the following measurements on 2048 consecutive bursts of a Wi-Fi signal:
- Burst start time
- Burst duration
- Average power of burst
- Maximum power of burst
- Minimum power of burst
- Burst count
All of these measurements are generated and stored in the buffer. By processing the samples in real time and keeping only the relevant burst information, an extremely large number of data points corresponding to up to 2048 bursts can be analyzed. An example data table captured in buffered mode is shown below, containing the information for 10 bursts of data. Also included are shorter control bursts. Figure 5 shows the data in graphical form.
This data was acquired using the sensor's "Burst Autogate" mode, which allows the user to define timing and capture parameters. The start and end of the burst are automatically identified by comparing the measured input signal to a preset signal threshold. Gate qualifying and delay options are available to align the gate interval with the desired portion of a burst.
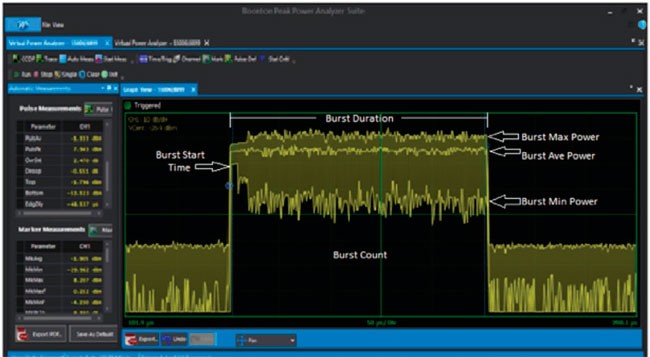
Figure 4. A typical Wi-Fi 802.11ac signal showing these six measurement parameters.
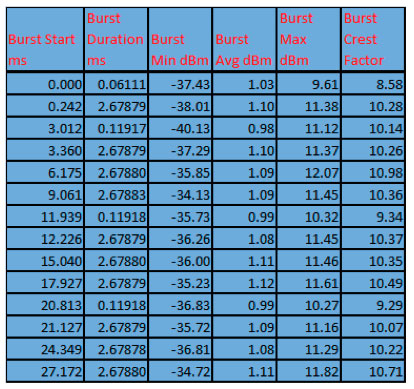
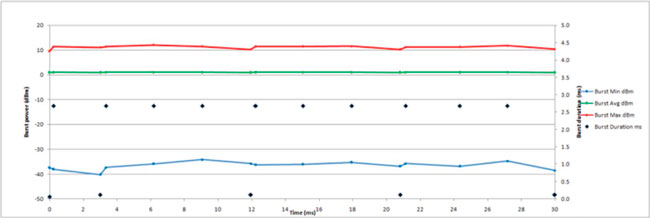
Figure 5. The data in the above table is shown in graphical form
As well as the Burst Autogate feature, Buffered Mode also offers the following options:
- Marker Gate – Markers are positioned in order to select the portion of interest.
- External Gate – The sensor's MIO (Multiple Input / Output) connector is used to input an external logic signal in order to select the portion of interest.
- External Trigger Gate – Each buffer entry is initiated via the MIO input, and ends after a user defined duration.
- Periodic Gate – Buffer entries are self-timed intervals with user defined period and duration.
As stated earlier, the ETSI standard demands that, for MIMO measurements, the total average power (summation of all ports) should also be recorded. In buffered mode, one sensor (the master) will generate a "gate" and the others will sample over this defined interval. In all configurations requiring a separate master and slave, the supplied "TriggerSync" cable must be used to interconnect the MIO connectors of the master and all slaves. One sensor, designated the master, sends a signal for the start of the bursts to the slaves in order to synchronize measurements on all ports.
The 55006 is capable of real time sampling at 100 MSamples/second. This extremely high rate exceeds that of the ETSI specification by a factor of 100, and therefore gives a high confidence that measurement accuracy will be much better than required. For short bursts a 1MHz sample rate may not give accurate results as the number of samples collected would be insufficient, but the sample rate of the 55006 is high enough to give a statistically significant amount of samples per burst in order to confidently measure the average power values as stipulated by the standard. In fact, as well as giving the average (mean) power of the burst, the performance of the sensor in terms of video bandwidth and sample rate also allows for accurate measurement of maximum and minimum burst power readings, therefore going beyond the requirements of the standard.
Effective Sample Rate
In triggered mode the ultra wide 195MHz video bandwidth of the 55006 ensures that the signal which passes through to the ADC input is a faithful representation of the original RF signal. The ADC then samples at a rate of 100 MSamples/sec. However, for repetitive time domain waveforms the sensor operates with an effective sample rate of 10 GSamples/sec, which is achieved by using a technique called Random Interleaved Sampling (RIS). This involves building a high resolution picture of the signal by capturing bits of information over several repetitions of the event, so samples from each acquisition are interleaved with those from other acquisitions. An internal clock running asynchronously to the trigger signal ensures that the samples are taken completely randomly with respect to the trigger, with the resultant composite trace having an effective sample rate of 10 GSamples/sec, or a resolution of 100ps. The 55006 is able to process up to 100,000 sweeps per second.
Beyond the Standard
As well as satisfying the measurement criteria of the ETSI standard, the Boonton 55006 is capable of making other important power measurements of Wi-Fi 802.11ac signals. These include power ramp on/off time and complementary cumulative distribution function (CCDF).
Preamble
Power versus time measurements of Wi-Fi signals are especially useful when measuring the preamble portion of a burst. This section is crucial for packet detection, automatic gain control, symbol timing and frequency and channel estimation. 802.11ac has ten symbols at the preamble, which translates to a burst length of 40us. Figure 3 above shows a 55006 display of a preamble section. With use of the vertical markers, the maximum, minimum and average power levels between any two points can be automatically displayed.
Ramp On/Off Time
A measurement of the ramp on/off time is important to ensure that the transmitter powers fully on and off rapidly enough. These times will vary depending upon amplifier design and control circuitry, but must be fast enough in order to satisfy the OFDM short Guard Interval of 400ns. The Guard Interval precedes each symbol in the OFDM signal, and prevents intersymbol interference due to multipath effects such as propagation delays, echoes and reflections. As long as these effects take place within the Guard Interval they will not affect the receiver's ability to decode the data, providing that the transmitter on/off time is a lot faster than 400ns. These measurements present no problem to the 55006, which is capable of making rise and fall time measurements in the order of 3ns.
Complementary Cumulative Distribution Function (CCDF)
A CCDF plot provides a useful method of assessing the performance of a power amplifier. The sensor carries out a statistical analysis of the signal and displays the result in graphical form, showing the percentage of time the signal's power exceeds any selected level. Either free-run or time-gated statistical measurements can be made, and figure 6 below shows 55006 time-gated CCDF plots of both the preamble and the data sections of a burst. The plots also show the Gaussian line for reference. The power axis is referenced to the average power of the signal, so when the plot crosses this axis, the selected power level is exceeded 0% of the time, therefore indicating the signal's crest factor. The crest factor, or peak to average ratio, is high for digital signals such as these, as is apparent in the above table, so the amplifier's linear region must be wide enough to handle them without causing clipping or distortion. Two 55006 sensors can be used to compare amplifier input and output CCDF plots. The sensor's ultra wide dynamic range, from -50 to +20dBm, ensures that accurate results will be obtained.
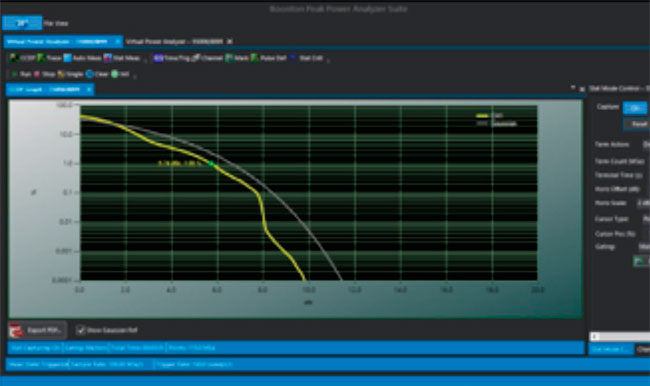
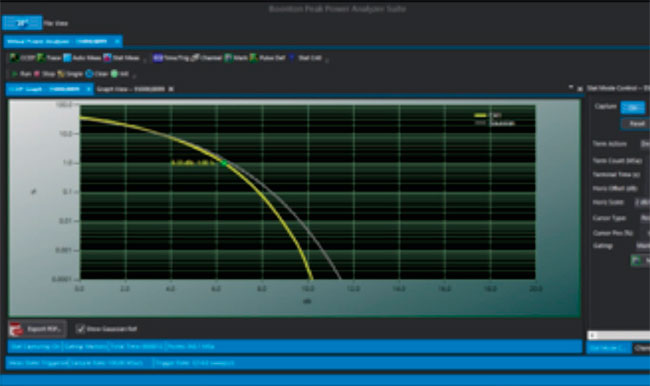
Figure 6. Top - CCDF plot of preamble.
Bottom - CCDF plot of data. The Gaussian reference line is plotted in grey.
Conclusion
This application note has shown that the Boonton 55006 USB Peak Power Sensor far exceeds the measurement requirements stipulated by the ETSI standard for 802.11ac Wi-Fi signals. With Real Time Power Processing™ and the newly introduced Buffered Mode, available only in the Boonton 55 Series, as well as the widest video bandwidth, the largest dynamic range, the highest sample rate and the best resolution at time bases down to 5ns/ division, the sensor is ideal for compliance, R&D, manufacturing and field testing of wideband signals such as Wi-Fi 802.11ac.